|
Overview
The project goal is to analyze and recreate an airfoil based on the NACA number. Then test and record the airfoil in simulated conditions. Then create an airfoil and test it to see if it matched the characteristics of its simulated counterparts. |
Boeing 314 Clipper Facts
The Boeing 314 was a long-range flying boat produced by the Boeing Airplane Company between 1938 and 1941. One of the largest aircraft of the time, it used the massive wing of Boeing’s earlier XB-15 bomber prototype to achieve the range necessary for flights across the Atlantic and Pacific Oceans. Twelve Clippers were built for Pan Am. Nine were transferred to the U.S. military. Three were sold to BOAC during the Battle of Britain (1940) and delivered in early 1941. |
Airfoil Data
Getting the vital data based on the NACA number involved looking up the NACA number for the chosen airfoil, and plotting its profile. We used the NACA 4 digit series profile generate to get the profile. This profile is used to create the airfoil for testing. |

Airfoil Simulation
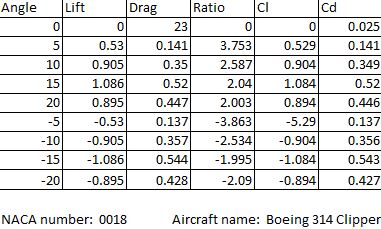
The NASA FoilSim applet calculates the lift of an airfoil based on user inputs of flow conditions and wing geometry. We used the NACA number (4415) to set the shape of the airfoil. The first number (4) represents the camber, the last two digits (15) represents the thickness. The size of the simulate airfoil is the same as the test airfoil (4" chord and 4" span). The flight conditions are set at 60 mph and the altitude is at 0. The data is recorded with the Angle of Attack is set to -20 and the Final Angle of Attack to 20 and the Angle of Attack Step to 5 degrees. Complete Foilsim Excel chart is below.
The NASA FoilSim applet calculates the lift of an airfoil based on user inputs of flow conditions and wing geometry. We used the NACA number (4415) to set the shape of the airfoil. The first number (4) represents the camber, the last two digits (15) represents the thickness. The size of the simulate airfoil is the same as the test airfoil (4" chord and 4" span). The flight conditions are set at 60 mph and the altitude is at 0. The data is recorded with the Angle of Attack is set to -20 and the Final Angle of Attack to 20 and the Angle of Attack Step to 5 degrees. Complete Foilsim Excel chart is below.
Construction
Construction of the airfoil was acheived by sandwiching 2 inches of foam between identical airfoil cross-sections made of 3/16" plywood. The foam was then cut out and sanded to match the cross-sections, and then the cross sections were removed and mounting clip was attatched. The scaled profile of the airfoil were used to create the cross-section pieces that served as the guideline for the airfoil itself.
Construction of the airfoil was acheived by sandwiching 2 inches of foam between identical airfoil cross-sections made of 3/16" plywood. The foam was then cut out and sanded to match the cross-sections, and then the cross sections were removed and mounting clip was attatched. The scaled profile of the airfoil were used to create the cross-section pieces that served as the guideline for the airfoil itself.


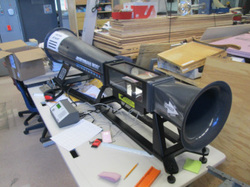
The airfoil was put into a wind tunnel and tested from -20 degrees Angle of Attack to +20 degrees Angle of Attack at 5 degree increments. Before testing, the same experiment was performed using the NASA Foilsim app set to the exact same conditions to calculate the lift/drag coefficient. Since it is a ratio, the scaling of the airfoil should have no effect on the outcome.
Test Results


Conclusion
1. Explain differences between the airfoil simulation prediction and the wind tunnel test results.
2. What characteristic of the airfoil had the most significant impact on lift and drag?
3. Explain what you would change in the design of your airfoil design?
1. Explain differences between the airfoil simulation prediction and the wind tunnel test results.
2. What characteristic of the airfoil had the most significant impact on lift and drag?
3. Explain what you would change in the design of your airfoil design?
